Design a Cooler, Greener and Energy Efficient Neighbourhood
A neighbourhood-scale digital twin to test interventions before spending millions
Heat risk
Energy poverty
Retrofit complexity
Current Twekkelerveld Condition
UHI peak (°C)
0
NDVI
0
Annual demand (MWh)
0
PV potential (MWh)
0
CO₂ (kt/yr)
0
Vulnerable HH (%)
0
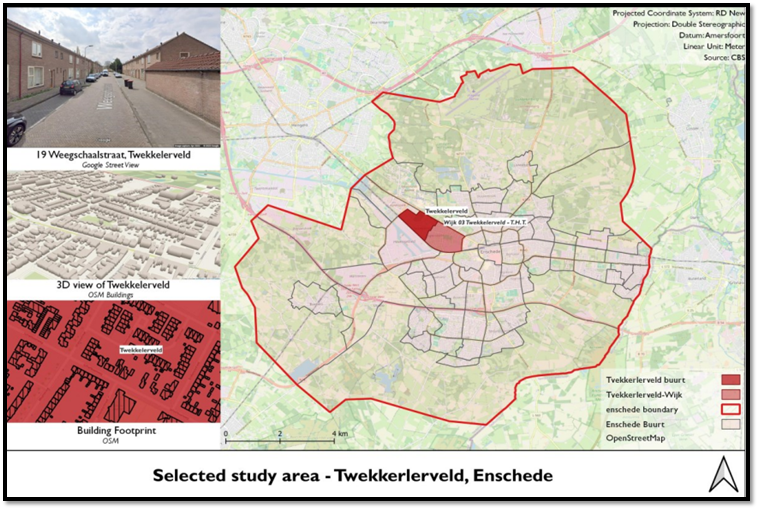
Why Twekkelerveld?
- Mixed building stock → retrofit tradeoffs are real.
- Heat + energy affordability collide here.
- Perfect scale: neighbourhood interventions actually measurable.
Preset scenarios
Energy-focused
PV-focused
Full rooftop PV · moderate retrofit (pre-1945 stock)
EnergyResidual ≈ 1.02 GWh/yr (−87%)
EcologyNDVI & UHI unchanged
Trade-offSingle-domain
Ecology-focused
Greening-focused
Maximum tree planting · maximum green roofs
EnergyEnergy use unchanged
EcologyNDVI up · UHI peak down
Trade-offSmall CO₂ via sequestration
Combined
Integrated
Moderate PV + moderate greening
EnergyPartial electricity & CO₂ reduction
EcologyModerate NDVI & UHI gains
Trade-offSouth-facing canopy reduces proximate PV yield
Location details
Learn from international examples on cooling, energy, retrofits and community solar.
Now
Hotter summers, rising bills.2027
Grid pressure + retrofit targets.2030
Policy deadlines (EU targets).2050
Climate baseline shift.Location details
Combined Scenario Analysis
Simulate integrated energy and ecology measures to maximise co‑benefits. Balance space and investment budgets while exploring greenness, heat, energy use, CO₂ and cost.
Intervention Controls
Investment Assumptions
● Live
Change cost assumptions to match your local context. Charts update instantly.
€
€
€
€
Baseline metrics: NDVI ~0.22, UHI ~9°C, energy ~5GWh. Adjust sliders to see impacts.
NDVI (base)
0.22
UHI (base)
9 °C
Energy
5,000 MWh
PV Pot.
650 MWh
CO₂
1.8 kt
Trees
2,400
Greenness (NDVI)
Base ~0.22
Urban heat (°C)
Base ~9 °C
Energy & PV
MWh/yr
Overall balance
Score
Stakeholder benefits
Score
Residents
- Cooler summers and improved health through more trees and green roofs
- Lower utility bills thanks to rooftop solar and deep retrofits
- Progress towards climate targets with lower CO₂ emissions
- Greater resilience and social equity for the neighbourhood
Greener
+0%
Cooler (UHI)
-0.0 °C
Energy demand
-0%
CO₂ balance
-0%
Total cost
€0
Protected HH
0%
Space used
0%